This post explains the negative increment effect and Edison data files. I have written about Edison data files before, and I am now organizing my thoughts on Debunked. I believe this explanation is important because it will likely be relevant in future elections. 🤫
Although the "vote switching" controversy surrounding Edison data files has largely been forgotten, it was once and for a while a major point of contention in the debate over election fraud in the 2020 presidential election.
🔸 What are Edison data files?
Edison data files had data of incremental changes in real-time ballot counting. These files were available on the websites of the New York Times and the Associated Press, and third-party organizations could also access them in real time via the API to generate election graphics.
After the election, many people analyzed and reconstructed the Edison data files. Their analyses and reconstructions demonstrated a "vote switching" effect, in which the number of votes for Trump decreased and the number of votes for Biden increased. This effect was caused by the rounding of percentage numbers in the Edison data files. See the file attached.
Let's check this out 😎
🔶 Edison data file format.
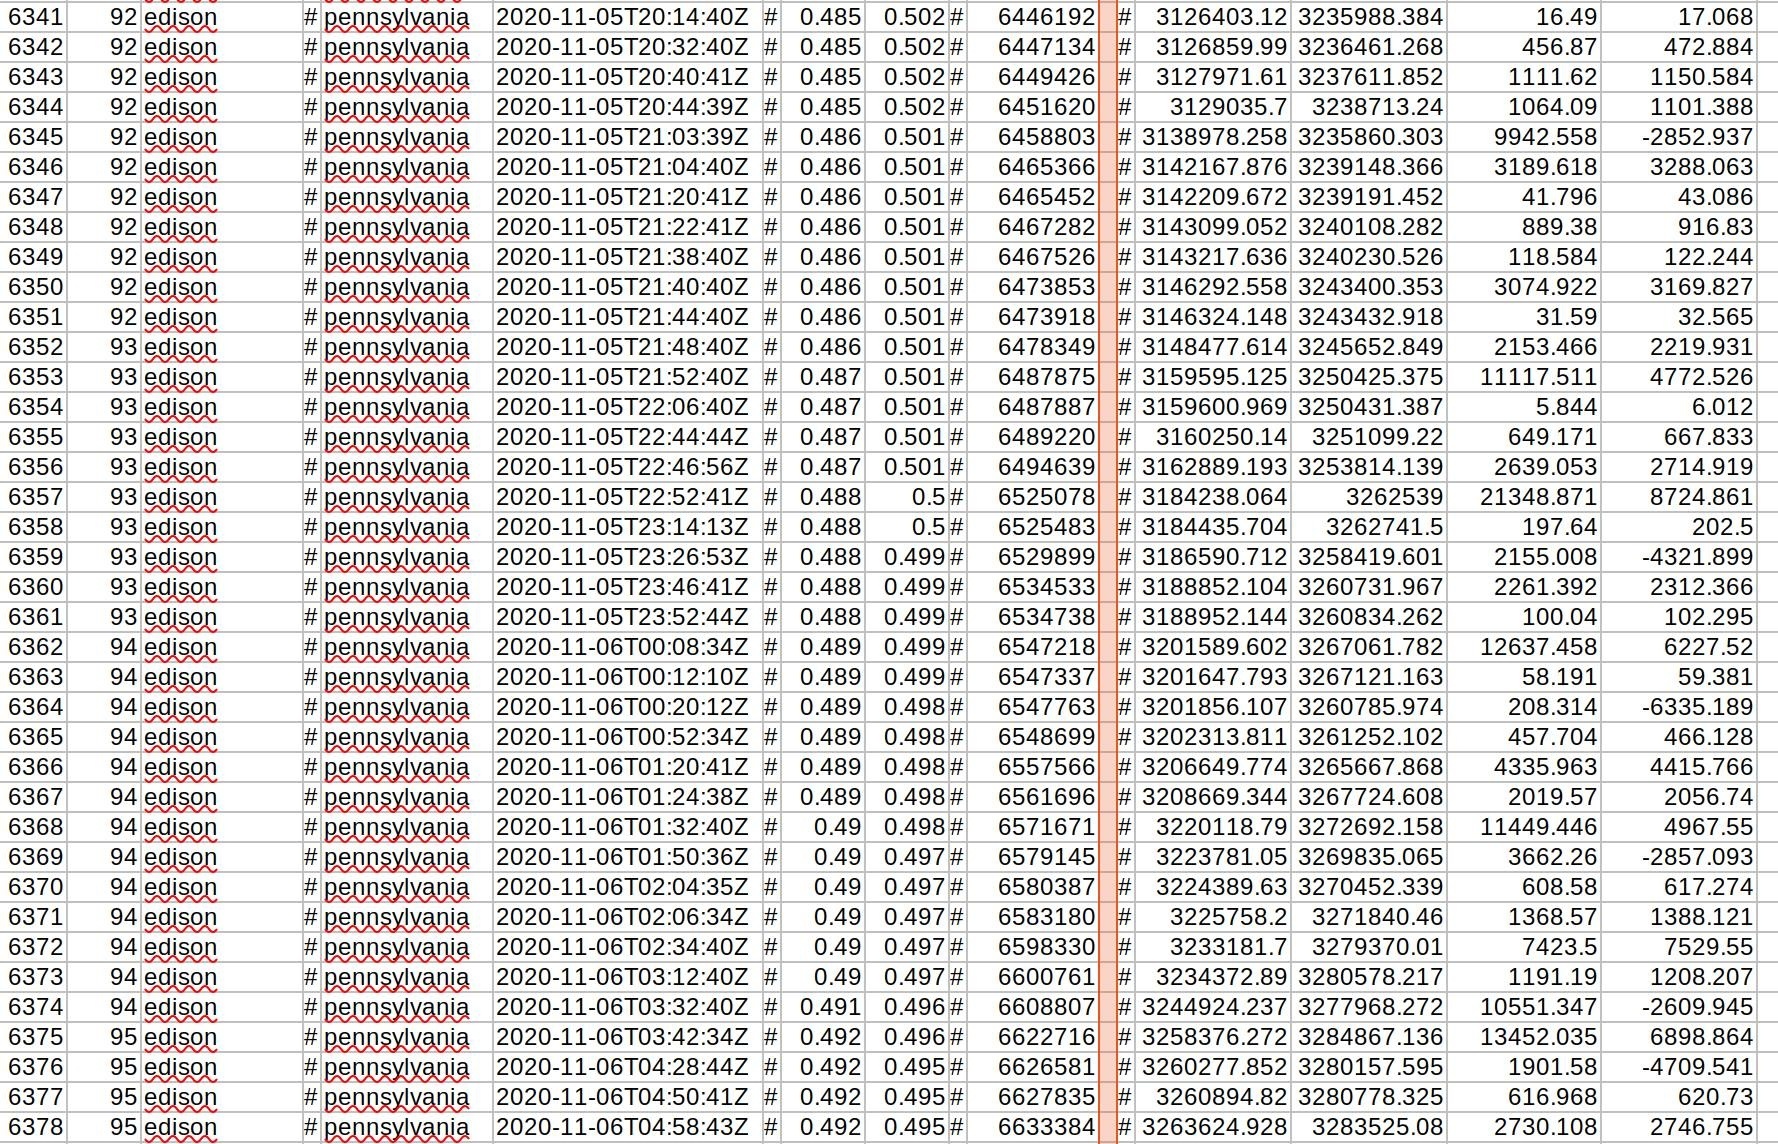
Edison data file was a delimited text file and the format (example for Pennsylvania) looked like this:
- Each row represents an incremental update in vote count reporting.
- There were 3 columns: total votes, % share for Biden, % share for Trump
current total; % Biden; % Trump
6449426; 0.485; 0.502
6451620; 0.485; 0.502
6458803; 0.486; 0.501
As you can see there were only 3 numbers available for each update and percentage numbers were rounded to only 3 decimal digits, so if we do a "reconstruction" i.e. multiply total by a given percentage we get approximate numbers.
For example:
- 0.01% of 6,449,426 is about 600 votes. 0.05% is 3000 votes.
- Given the rounded 50.2% you can't tell if it was in reality 50.24% or 50.15% rounded towards 50.2%.
🔸 Reconstruction attempts.
When people did reconstruction of real numbers they multiplied updated totals by 0.502 (this is what was available) while in reality it could have been 0.502312 or 0.501512 (we can't tell). The 4th, 5th precision digits were not available in Edison data files for percents.
Thousands of votes were "swallowed" this way during the reconstruction.
If the trend of reporting during the real-time counting is downwards for one of the candidates, then after the last available decimal digit of the percentage decreases, the number of votes in the reconstruction will decrease as well. This can create the appearance of "negative vote increment" or "stolen votes."
🔶 Effect of rounding - explanation.
Please see the attached picture that shows the effect of rounding. The negative vote switch effect happened also for Biden (numbers to the right of the orange vertical line are calculated reconstruction).
In reality, given 50.2% one can't tell if it was 50.24% or 50.15% or something in between after the increment. However when people did reconstruction of real numbers they multiplied totals by 50.2%.
It is important to note that the Edison data files on the NYT website were not raw data, and they could not be used as proof of election fraud.
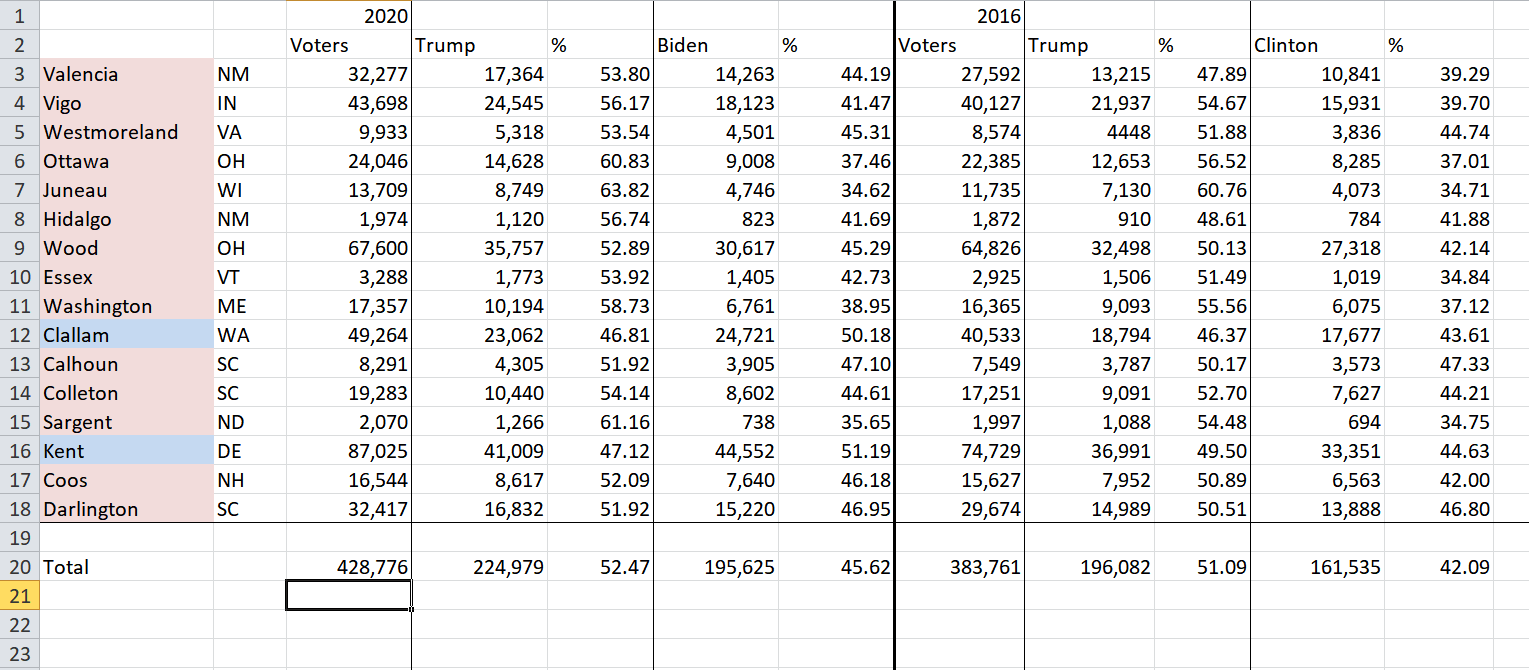
The Bellwether Counties argument is frequently cited on Twitter as evidence of an anomaly in the 2020 elections. In 2020, Trump won the popular vote in bellwether counties but lost the election, whereas in 2016, he won both the popular vote in these counties and the election.
The argument states: there are 15-20 bellwether counties, and the candidate who wins the popular vote in these counties will win the General Election.
This concept is flawed since the winner of the General Elections is not decided by the popular vote but by the Electoral College.
Interestingly, there is only one county in the United States that has consistently voted for the winner of the presidential election since 1980: Clallam County, WA.
I have identified 16 bellwether counties that have allegedly predicted the winner. Among them are three counties in South Carolina (Calhoun, Colleton, and Darlington), two in Ohio (Ottawa and Wood), and two in New Mexico (Valencia and Hidalgo).
What do bellwether counties predict, and what do they ...
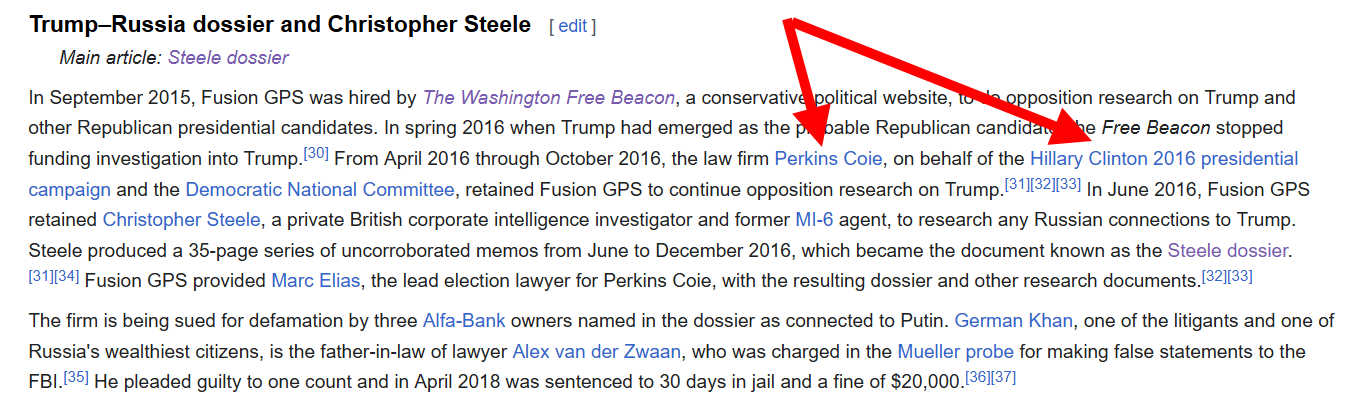
People think that the Wikipedia is not a reliable source because anyone can edit any article.
📣 Actually, Wikipedia is an excellent source for information. However, it is important to learn how to use it effectively. Here are a couple of examples of how to dig into a Wikipedia article:
- You can check the Wikipedia article in other languages and cross-check the information using Google Translate. The information on the same subject may vary significantly depending on the language in which it is written.
- You can go through the history of Wikipedia article edits and compare the information. You may discover that some essential information was removed by an editor.
I plan WIKI to be a series of articles on the Debunked, where debunking can be done solely using Wikipedia.
Russian Collusion was an alleged interference between the Trump campaign and Russia to interfere in 2016 elections. The Mueller report "did not establish that members of the Trump campaign conspired or coordinated with the Russian government in its ...


On September 26, 1983, Stanislav Petrov, a duty officer who was stationed in the nuclear early-warning system of the Soviet Union saw a big RED BOLD message all over the screen - 5 missiles launched from bases in the United States.
Petrov saved the world by not reporting them to his superiors, and instead dismissed them as a false alarm. This was a breach of his instructions, a dereliction of duty. The safe thing to do would have been to pass the responsibility on, to refer up.
https://en.wikipedia.org/wiki/Stanislav_Petrov
https://www.bbc.com/news/world-europe-24280831
After the collapse of the Soviet Union, the story did get into the press. Mr Petrov received several international awards. But he does not think of himself as a hero 😆
"That was my job", he says. "But they were lucky it was me on shift that night."
📣 The story has all attributes of a classic hoax: only one source, no witnesses, unnecessary visual details that make the story sound more trustworthy.
🧵 Context 1: ...